The observational properties of GRBs can be found in a number of review articles e.g. Fishman & Meegan 1995, Piran 1999 & 2000, van Paradijs et al. 2000. Here we provide a brief summary of their main features. The GRB emission is observed to last from less than a second to hundreds of seconds. The gamma-ray light-curve varies on short time scale, in some cases of order a milli-second. The distribution of GRB durations is bimodal, with peaks at 0.3s and 30s. Bursts with duration less than 1s are called short GRBs and those that last for 5s or more are referred to as long GRBs. The fluence, the energy received per unit area integrated over the duration of the burst, varies by three orders of magnitude, from 10 -7 to 10 -4 erg cm -2, and the peak flux has, similarly, a very broad distribution. The spectrum of GRBs is non-thermal, well approximated by a broken power-law, with a peak energy between 100 and 300 keV 1. A number of very interesting properties of the GRB spectrum and light-curve have been discovered over the years (e.g. Piran 1999, van Paradijs et al. 2000). More recently, the correlation of the pulse spectral lag with GRB luminosity has been studied by Norris et al. (2000).
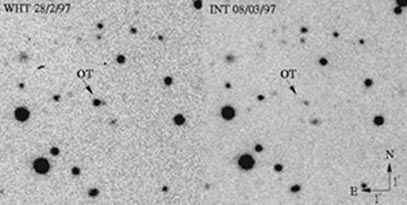
The progress made in the last five years has finally brought the understanding of these enigmatic bursts within our reach. This advance has been driven by observations and furthered by the modeling of their afterglows. In particular, the Italian-Dutch satellite BeppoSAX, launched in 1996, improved the localization of these explosions to within 5 arc-minutes (for comparison, BATSE could determine the location of the GRBs to only about 4 degrees). This made it possible to search for GRB optical counterparts, to measure their redshifts from interstellar absorption lines and identify their host galaxies. To date 35 GRBs redshifts have been determined, the typical redshift for long-duration bursts being about 1. From the distance, the observed fluence, and under the assumption that these explosions are isotropic, the energy release in gamma-ray photons can be estimated. For the most energetic explosions, the isotropic equivalent of energy in gamma-rays is estimated to be 10 54 ergs (Kulkarni et al. 1999). As discussed below, it appears that some, if not all of these explosions are highly non-spherical and the relativistic material ejected in these explosions is collimated in a narrow cone of 5-10 degrees opening angle.
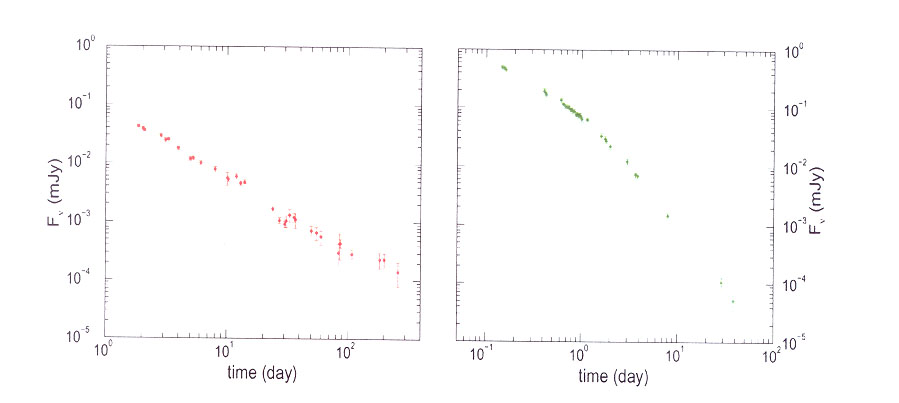
The optical flux from a typical GRB afterglow has a power-law
decay, t-1.0 ![]() 0.3 (figure 1a) and
a n0.9
0.3 (figure 1a) and
a n0.9 ![]() 0.3
0.3
frequency dependence. In several cases the light-curve decay steepens
to t2.2![]() 0.5 a few days after the explosion
(figure 1b). The most natural explanation for this steepening
is that GRB explosions are not spherically symmetric, the break
in the light-curve occuring when we start to see the edge of the
jetted ejecta (Panaitescu & Meszaros 1998) and the effect
of the jet lateral expansion (Rhoads 1999).
0.5 a few days after the explosion
(figure 1b). The most natural explanation for this steepening
is that GRB explosions are not spherically symmetric, the break
in the light-curve occuring when we start to see the edge of the
jetted ejecta (Panaitescu & Meszaros 1998) and the effect
of the jet lateral expansion (Rhoads 1999).
The reason for the steepening of light-curve is not diffcult
to understand. At early times when the Lorentz factor (LF) of
the jet, g , is larger than the inverse
jet opening angle q j-1
we only see part of the jet surface - the visible area is r 2/
g 2 - and we cannot tell
whether the explosion is spherical or not. With time the jet decelerates,
the LF decreases, and we see a larger and larger fraction of the jet
surface. When g falls below g q j-1 we receive
emission from the entire jet surface, of area r 2 q j2 , which is
less than the visible area for a spherical explosion by a factor
of (q j g)-2,
resulting in a smaller observed flux and a steeper decline of
the light-curve. The sideways expansion of the jet, due to pressure
gradient, results in a more rapid decrease of the jet LF with
time and also contributes to the steepening of the light-curve.
The calculation of light-curves from a shock-heated, collimated,
relativistic out flow has been carried out by a few research groups.
However, all of these works to date have been based on a simplied
model and a number of ad-hoc assumptions. One of the most restrictive
assumption is that of a uniform jet, i.e. the LF and the energy
density are independent of the angular coordinate, and the dynamics
of the jet is modelled as a uniform expansion at the sound speed.
Another simplification made is that the strength of the magnetic
field and the electron distribution are determined by assuming
that the magnetic field and electron energies are constant fractions
of the thermal energy density of the shocked fluid. Some progress
has been made recently toward understanding magnetic field in
relativistic shocks: the numerical simulations of Medvedev (2002)
show that magnetic field generated behind shocks via the Weibel
instability do not decay with distance to very small values, as
was previously thought. Moreover, the modeling of GRB afterglow
light-curves indicates that the energy fraction in electrons is
close to equipartition (Panaitescu & Kumar, 2001), hence the
parametrization of electron energy is not a serious drawback of
current models. Thus, at present, the biggest uncertainity in the afterglow
modeling is the assumption of a uniform jet and the simplied jet
dynamics.
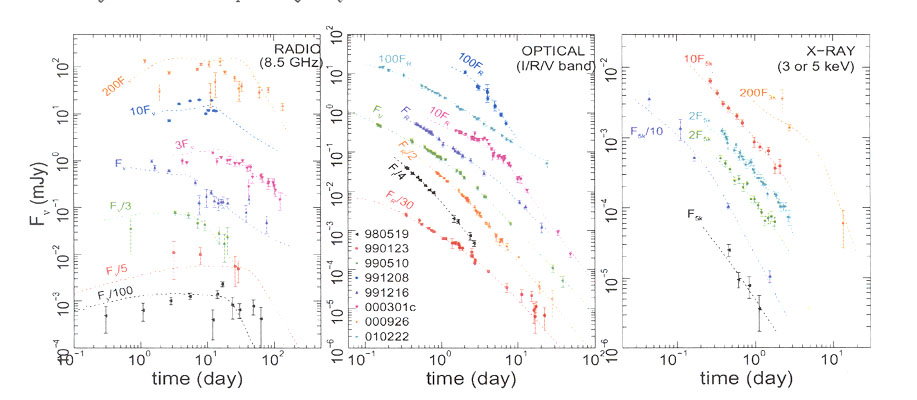
Fig. 2: Radio, optical and X-ray
emission and model light-curves for the GRB afterglows 980519,
990123, 990510, 991208, 991216, 000301c, 000926, and 010222 (legend
of middle graph applies to all panels). The numerical light-curves,
taken from Panaitescu & Kumar 2001, were obtained by minimization
of c2 between model emission
and the radio, millimeter, sub-millimeter, near infrared, optical,
and X-ray data (only a part of the used data is shown in this
figure). Optical data has been corrected for Galactic dust extinction.
The spread around the model curves exhibited by the radio emission
of 980519, 991208, 991216, 000301c and 000926 can be explained
by fluctuations due to scatterings by the inhomogeneities in the
Galactic interstellar medium (Goodman 1997). Fluxes have been
multiplied by the indicated factors, for clarity.
A comparison of theoretically calculated light-curves, under the simpling assumptions described above, with observed light-curves in x-ray, optical, and radio bands for 8 GRBs has led to a number of very interesting results (Panaitescu & Kumar 2001); the fits to the light-curves are shown in fig. 2. Perhaps the most remarkable discovery is that the kinetic energy in the relativistic out flow is nearly the same, within a factor of 5, for the set of eight GRBs (figure 3). A similar result has been obtained by Piran et al. (2001) through a method which requires fewer assumptions. Frail et al. (2001) have also found that the energy radiated in GRBs does not vary much from one burst to another. The opening angle for GRB jets is found to be in the range of 2-20 degrees, and the density of the medium in the vicinity of GRBs is estimated to be between 0.1 and 30 per cc (fig. 3) Moreover, there is no firm evidence for the density to vary as inverse squared distance in all but one case (Price et al. 2002; Panaitescu & Kumar, 2002), which is surprising in the light of the currently popular model for GRBs - collapsar model - and of the underlying supernova suggested by a plateau in the optical light-curves (e.g. Bloom et al. 1999 & 2002, Reichart 1999, Galama et al. 2000).
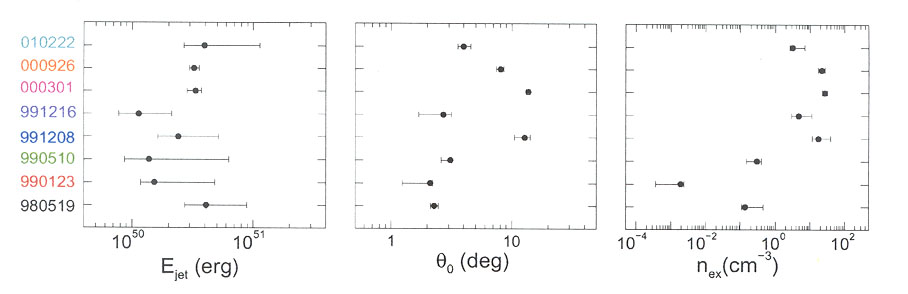
Fig. 3: Best fit model parameters
and their 90% condence intervals for the afterglows shown in Figure
2. The left panel shows the initial energy in relativistic jets,
the middle panel is initial half-angle of the jet q 0
, and the right panel shows the density of the circum-burst
medium; this figure is taken from Panaitescu & Kumar, 2001.
REFERENCES
Bloom, J.S., et al. 1999, Nature, 401, 453
Bloom, J.S., et al. 2002, astro-ph/0203391
Fishman, G.J., and Meegan, C.A., 1995, Ann. Rev. A&A, 33,
415
Galama, T.J., et al. 2000, ApJ, 536, 185
Goodman, J. 1997, New Astronomy, 2, 449
Kulkarni, S.R. et al., 1999, Nature 398, 389
Medvedev, M.V., 2002, in "Gamma-ray Bursts: The Brightest
Explosions in the Universe"
Norris, J., Marani, G. & Bonnell, J. 2000, ApJ, 534, 248
Panaitescu, A., & Mesz aros, P., 1998, ApJ, 503, 314
Panaitescu, A., & Kumar, P., 2001, ApJ 560, L49
Panaitescu, A., & Kumar, P., 2002, ApJ, 571, 779
Piran, T., 1999, Physics Reports, 314, 575
Gamma-Ray Burst Photo from this website: www.aip.de/People/JGreiner/grb970228.html